28.05.2020 | Prof. Dr. Roland Helm, Prof. Dr. Reinhard Meckl, Christine Hofstetter, Martin Schmalfuß
The M&A Canvas for analyzing the strategic fit of acquisition candidates (Part 2)
Allgemein, General, optional, combuyn, Strategien & Visionen
1. Introduction
As already mentioned in part 1 of our article, the M&A Canvas will be presented below as a synergy identification tool. The concept will be clarified with an example and its practicability will be discussed.
2. Strategic Fit Analysis using the Canvas method
2.1 Five steps towards an M&A Canvas
The analysis of the strategic fit using the Canvas method consists of five key steps (Fig. 1), which are explained in more detail below.
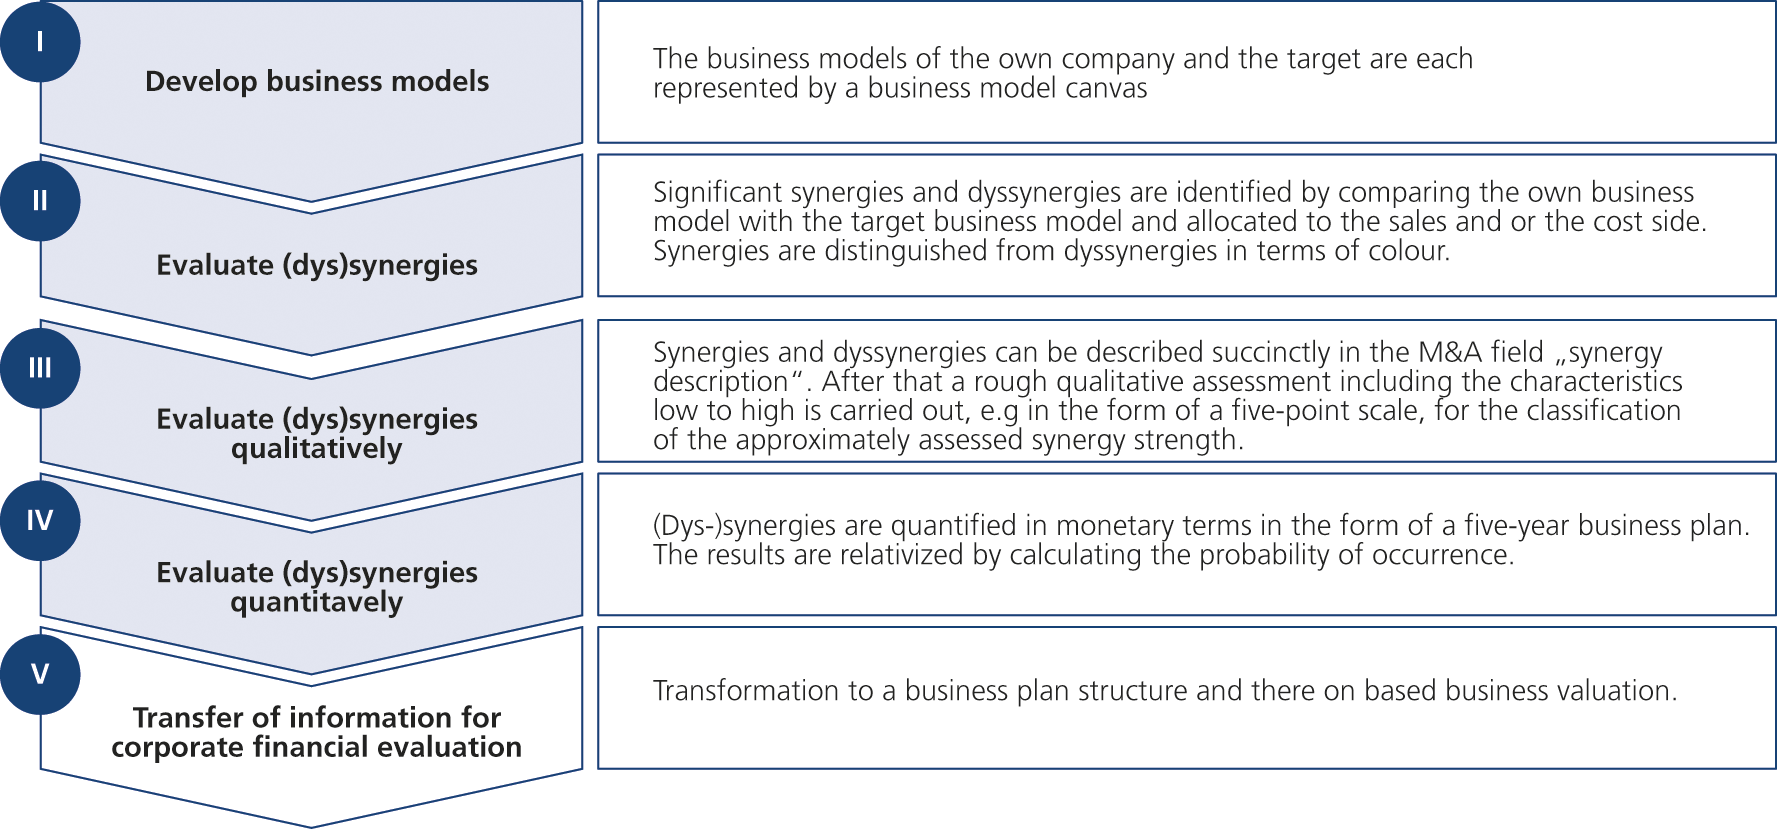
Step I: Elaborate the business models involved
Understand own business model
Before starting with the preparation of an M&A Canvas, it is essential to understand the own business model or even better, to document it. The creation and establishment of the own business model will not be discussed at this point for this is an upstream activity of strategic management. For this we refer to the existing literature that describe the procedure for creating business models.[1. See for example Bridgeland/Zahavi: Business Modeling – A Practical Guide to Realizing Business Value, Amsterdam et al., 2009; Gassmann/Frankenberger/Csik: Geschäftsmodelle entwickeln: 55 innovative Konzepte mit dem St. Galler Business Model Navigator, 2nd edition, München, 2017; Hoffmeister: Digital Business Modelling: digitale Geschäftsmodelle entwickeln und strategisch verankern, 2nd edition, München, 2017. Engelhardt/ Petzolt: Das Geschäftsmodell-Toolbook für digitale Ökosysteme, Frankfurt am Main and New York, 2019 or also to chapter 3 with respect to the description of each canvas field.] The important result of this step is the presentation of the own business model within the Canvas framework. For an example for a typical field in Canvas compare chapter 1.3 Examples.
Select the right level of abstraction
At this point, particularly the need to address the proper level in the creation of the own business model is to emphasize. This depends mainly on the M&A target, which is to be assessed. If the M&A target is mainly intended to help for example the business model of a specific strategic business unit of a larger company, then the sub-business model may have to be used as a basis. In regionally oriented M&A the specific business model of a regional entity, which is to mainly integrate the target, is the right level of analysis. In these cases, the use of the parent company’s business model is due to the high level of abstraction less suitable for the subsequent strategic fit review of the target.
Understanding the target business model
One of the core activities within the M&A Canvas is the understanding and documentation of the business model of the target company. Here, the entire company will be considered and documented in the business model Canvas (compare for a possible documentation style figure 5, top left). A thorough execution of the generation of data and information concerning the target are necessary. The latter is an indispensable pre-condition for a successful documentation of the target business model within the Canvas framework. This is based on all available information to the target. It is important to document the main aspects in the individual canvas fields. This preparation should be made as far as possible without a look at the own business model, in order not to be misled in the further process or to let aspects wrongly unnoticed. The implementation of this step must in any case be accompanied by employees who have the best possible knowledge of the market and, of course, the best possible knowledge of the target.[2. For sources and methods for information gathering compare for example Lucks/Meckl, 2015, pp. 330-333.]
Step II: Identify (dys)synergies
Once the own and the target business model are available in the form of a business model canvas, it is much easier to identify possible and especially realistic positive and negative synergies. For that, the two Canvas business models are compared with respect to synergies in the next step. Clues to potential sources of synergies are given in Figure 1. There are four main options (for more examples see chapter 3.2.)
The target business model complements the own business model (synergy):
Typical examples may often be found in the “key resources” (compare Figure 3). The absorption of technological know-how from the acquired company qualifies for that. In the field of “key partnerships” the usage of supplies from competent suppliers of the target company may lead to additional cash flows.The own business model complements the target business model (synergy):
What has been said above of course qualifies vice versa. The target company may profit from the access to the large home market of the (new) parent which is a synergy from the “channels” and “customer relationships” canvas field.The target business model leads to a negative business impact (dyssynergy) in case of a merger of the two companies. “Key partnerships” or “customer relationships” may be damaged, when in a vertical integration the acquirer after the acquisition may be considered a competitor to the previous partners up- or downstream the value chain. Another example may be the case, if it can be assumed that identical customers are served by both companies and can be expected that at least a large part of the customer, after a merger, seeks a new second source of supply.
The own business model leads to a negative business impact (dyssynergy) in case of a merger of the two companies.
With the implementation of parent company’s organizational, legal and human resources regulations, the flexibility or innovativeness of the target may be damaged in the field of “key activities”. When big companies take over small start-ups, this may happen.
Step III: Evaluate (dys)synergies qualitatively
The third step in examining the strategic fit with the help of the M&A Canvas is the qualitative evaluation of potential synergies or dyssynergies.
For this purpose the (dys)synergy potentials, which were identified in step II, will be sorted initially by relevance, i.e. the aspects with presumably very high synergy or dyssynergy potential on the revenue and cost side are listed first. Here, a simple five-point scale is ideal, whereby awarded five points flag a very high importance and one point indexed a very low importance. At this stage, a consideration of the impact within several years after the closing should be taken into account.
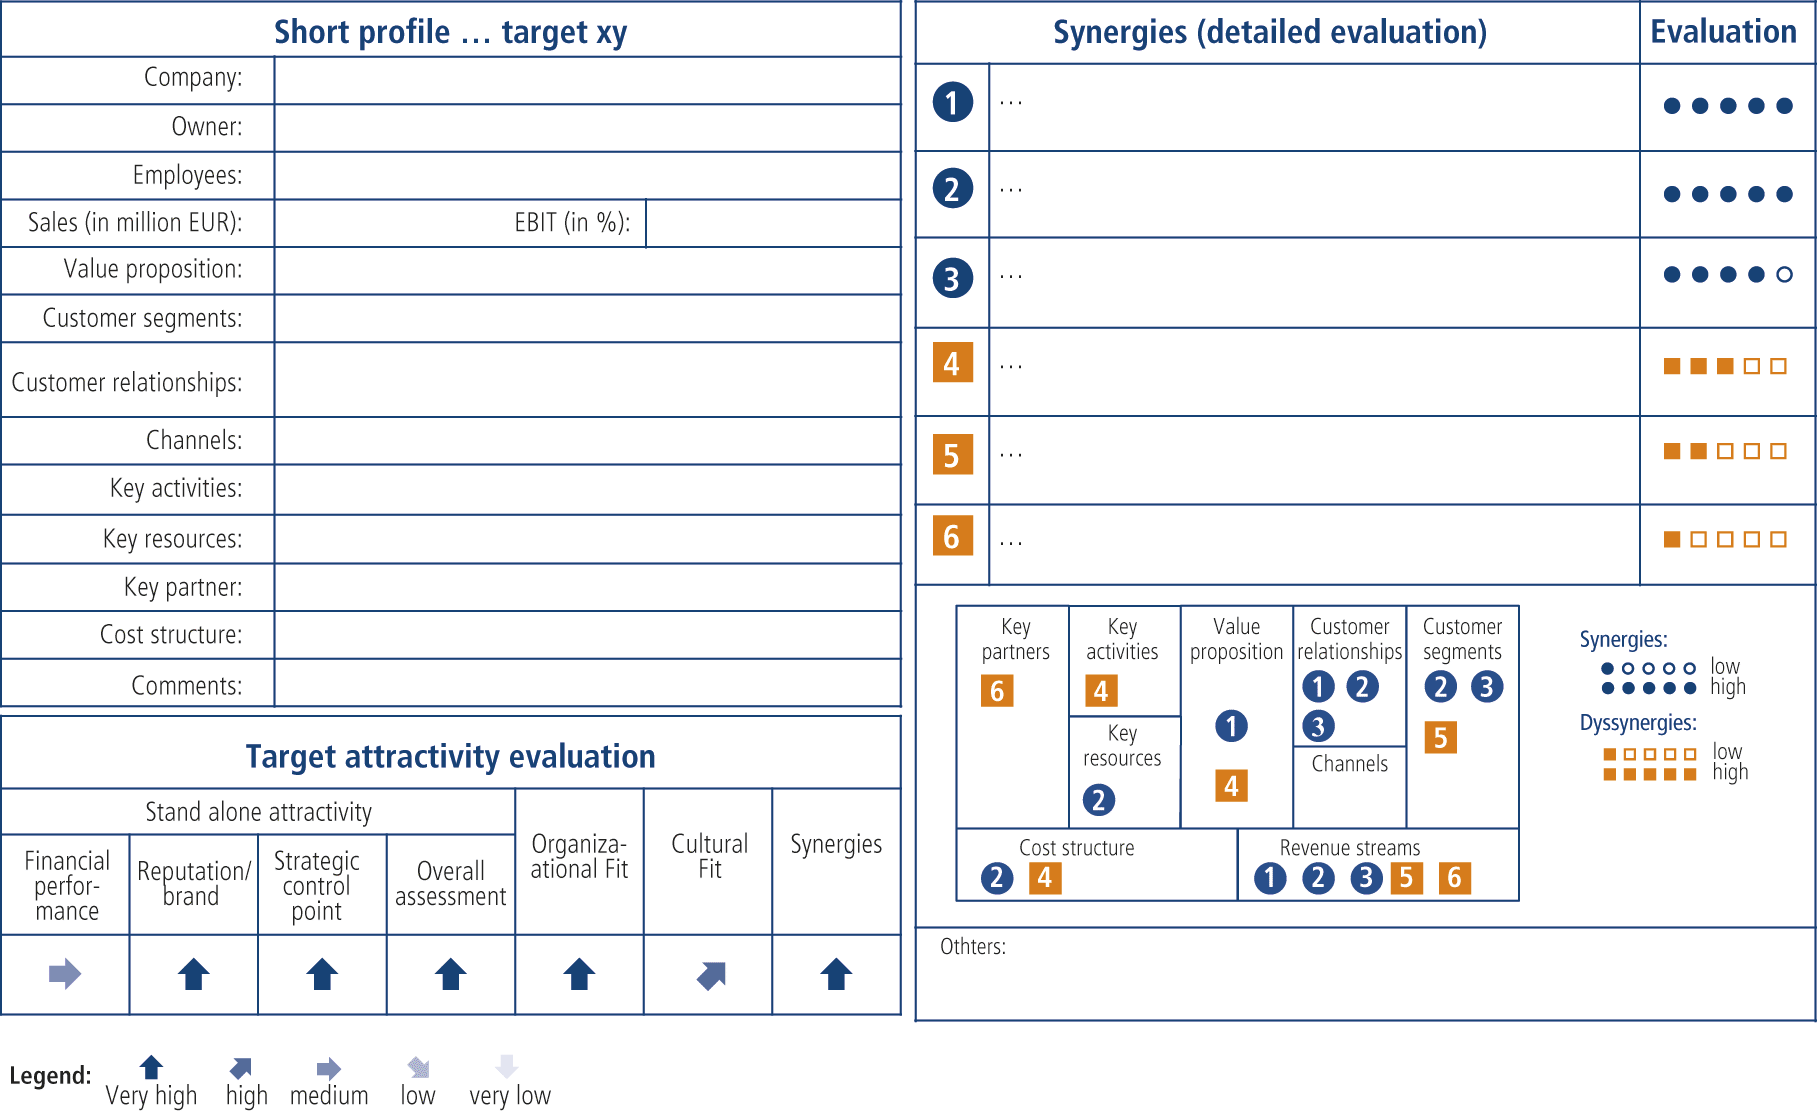
To document the steps I to III and to derive a strategic fit, Figure 2 shows a proven form of documentation. It basically consists of three areas. The area on the top left is for the outline of the target. In addition to the corporate key data of the target (company name, owner, sales, profit margin, etc.) also the main points of the business model canvas are to be inserted.
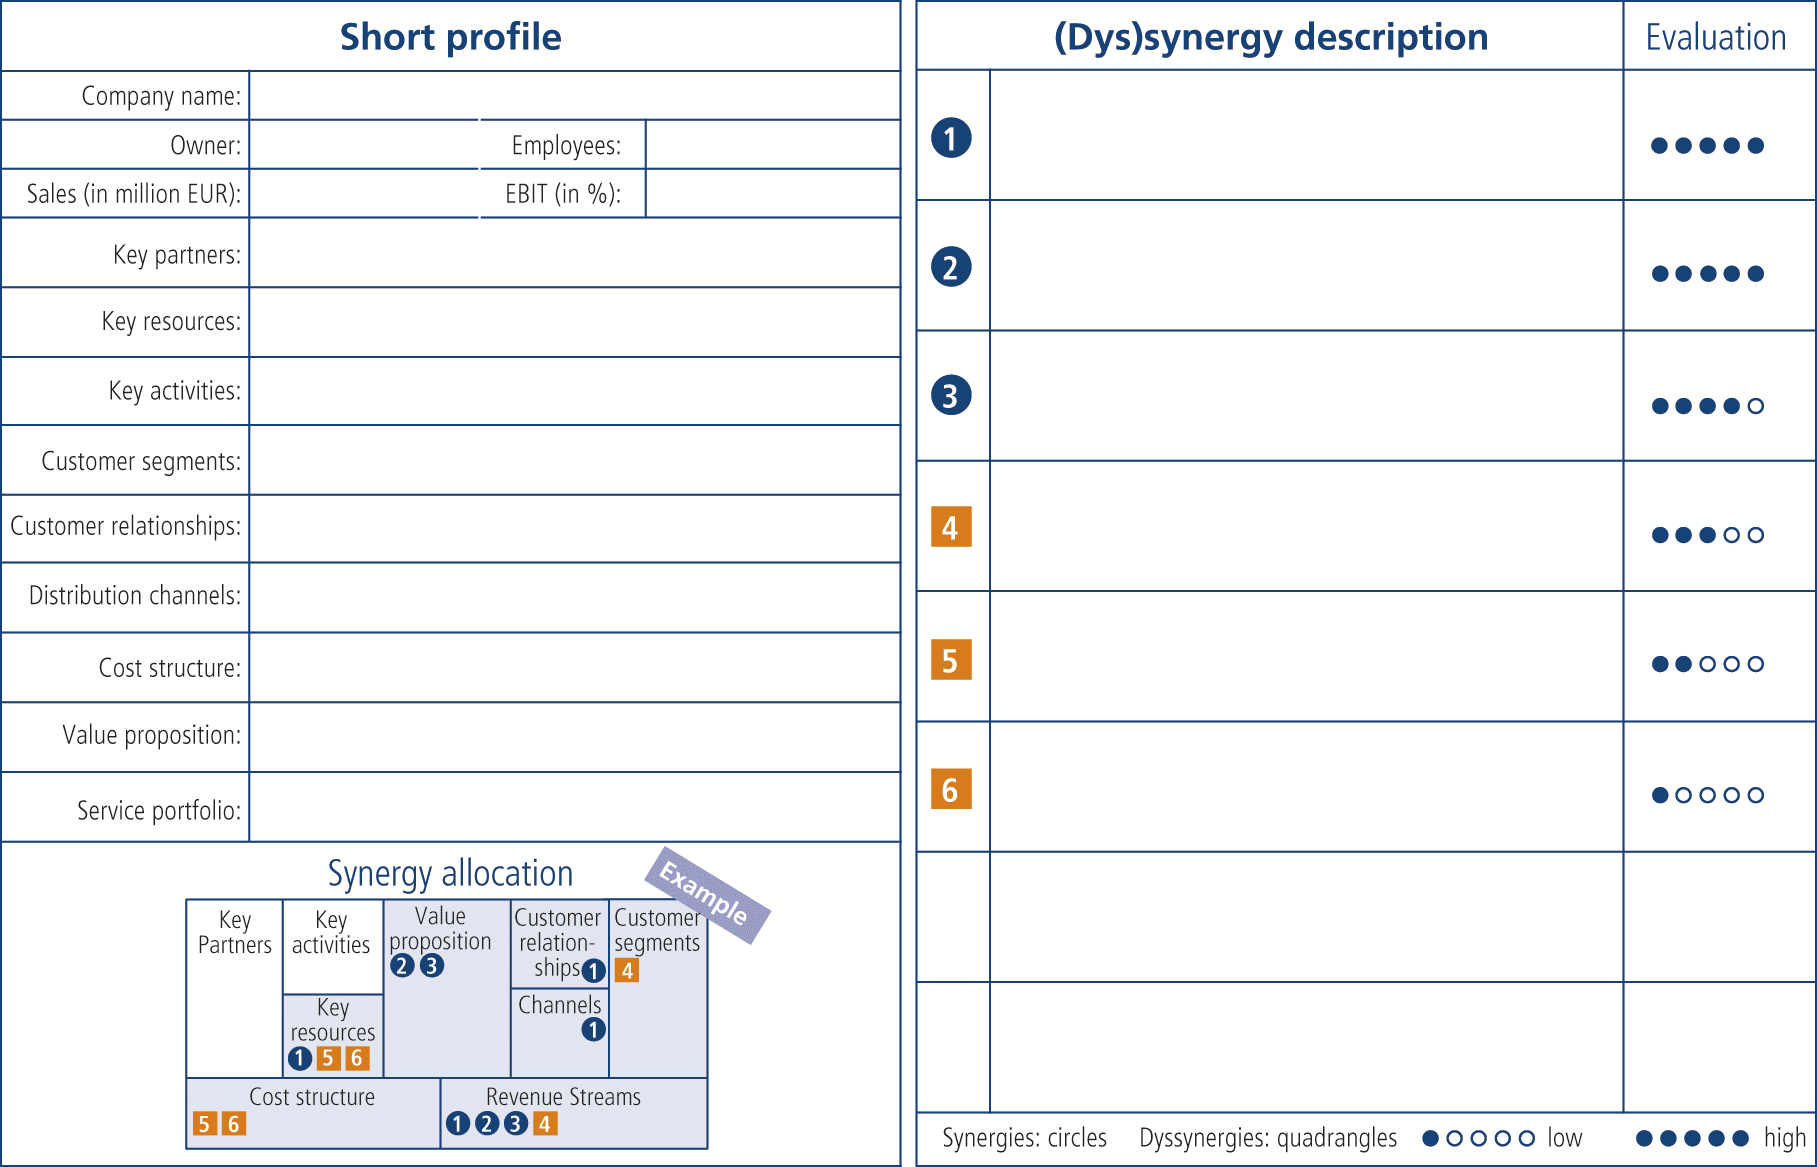
In the field on the bottom left, those fields, which have (dys)synergy potentials, are highlighted with color in the illustrated business model canvas. Another step is the allocation of the individual (dys)synergies on both the cost and/or sales side, which ultimately includes the statement as to whether the (dys)synergies will have an influence on the revenue side, on the cost side or on both sides.
The identified (dys)synergies are documented on the right side of the M&A Canvas in the form of a brief description. The rough evaluation of the (dys)synergy strength should be visualised by the five-point scale already described. To identify dyssynergies, squares are used instead of circles in the numbering column.
After the M&A Canvas has been developed on a qualitative basis, a further elaboration by quantifying the findings that have been produced in step III is the necessary next step. It should be noted that the preparation of a qualitative M&A Canvas is in most cases sufficient for a fundamental review of the strategic fits and an assessment of the strategic rationale of the intended transaction. In practice, the M&A Canvas allows a good comparison of several acquisition candidates. It presents results in a compact way, without the need to perform the quantification of (dys)synergies. For the candidates which qualify for an estimated high strategic fit, a quantification, described in the next section of the article, is to be conducted.
Step IV: Quantified assessment of (dys)synergies
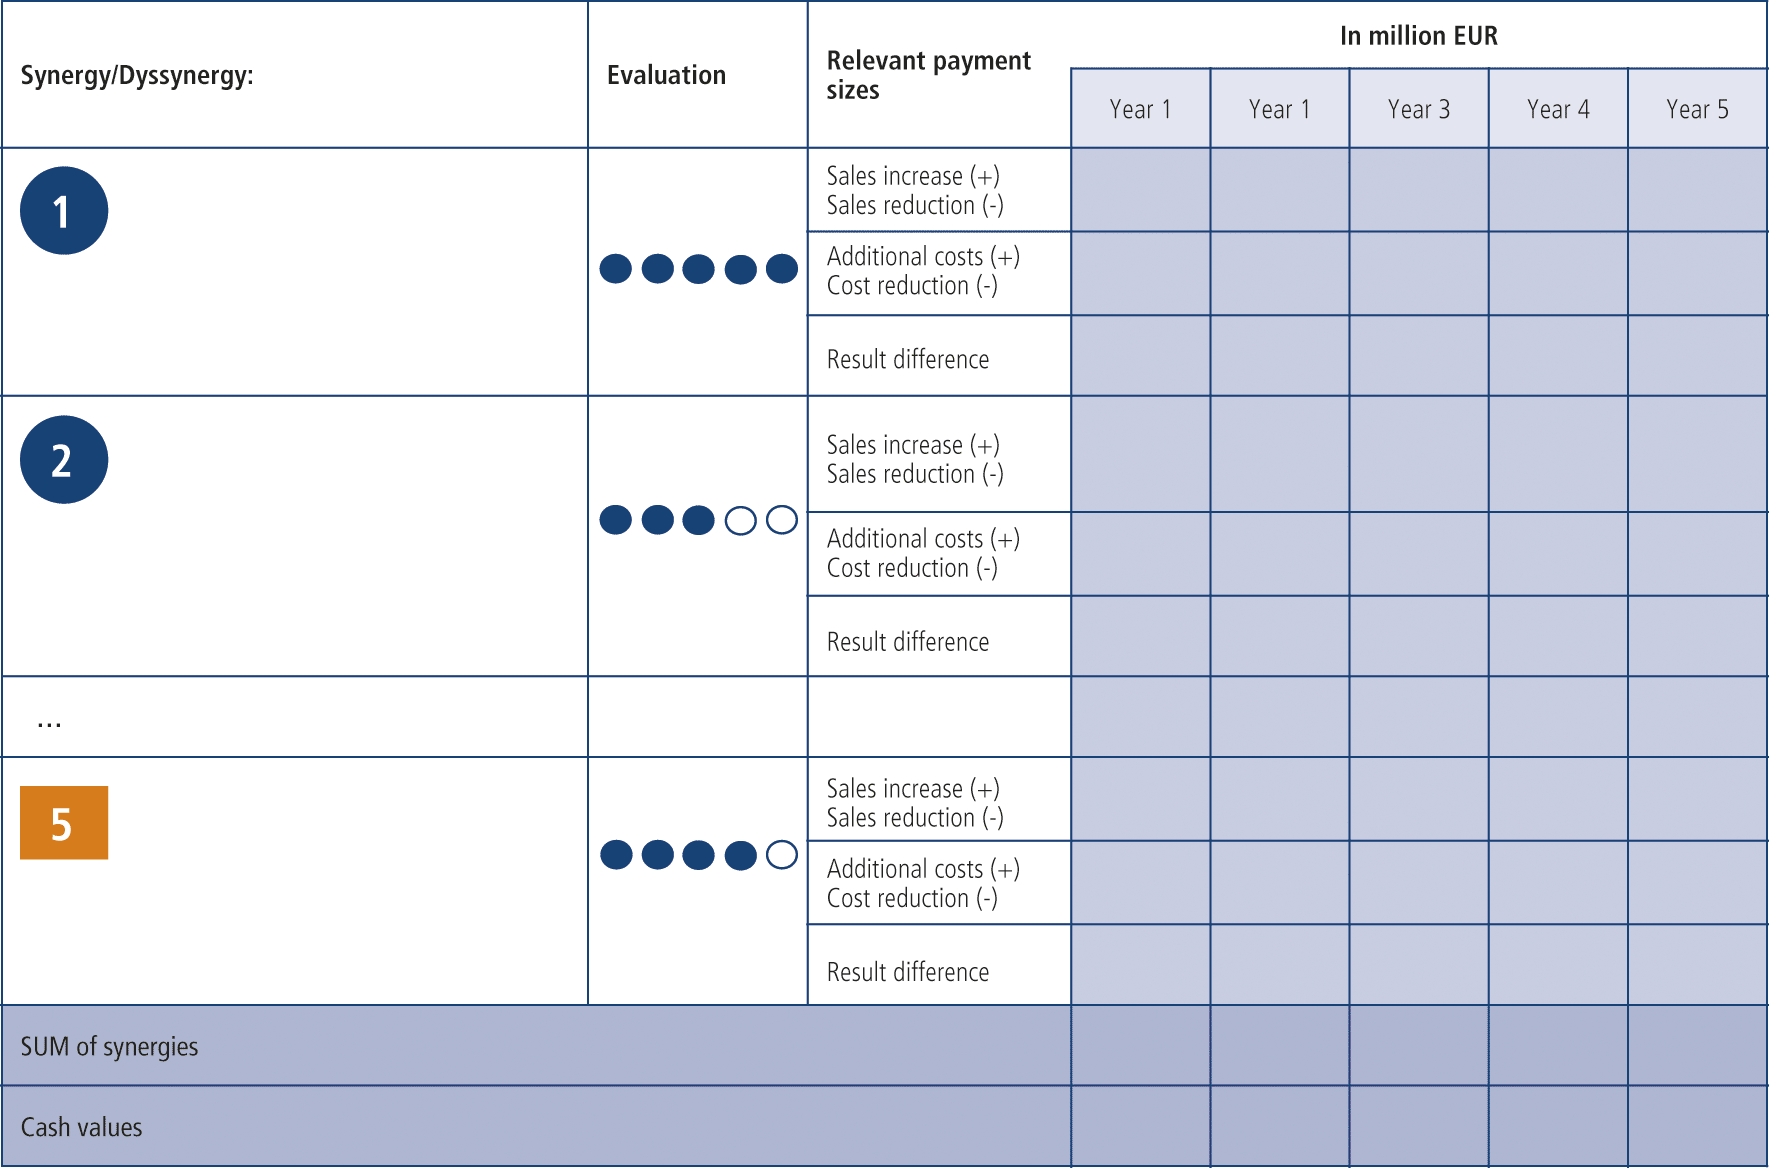
In this step, the (dys)synergies, which were, with the help of the five-point scale, identified in the qualitative M&A Canvas and which were important for turnover and cost, are going to be quantified. For this purpose it should be noted that the quality of this elaboration is essentially dependent on both the available information about the target as well as the correct assessment by relevant experts. For example, it is quite difficult to assess identified synergies on the production side, if only very rudimentary information about the production cost situation of the target exist. The situation is made even more complicated by the fact that we are still in a very early stage of the M&A process (compare chapter 2, Figure 1) with no direct access to the target. Nevertheless, a systematic treatment of the individual potential synergies makes sense, even with poor information situation, because in an ongoing M&A process this information can always be sharpened further, especially in negotiations and within the due diligence.
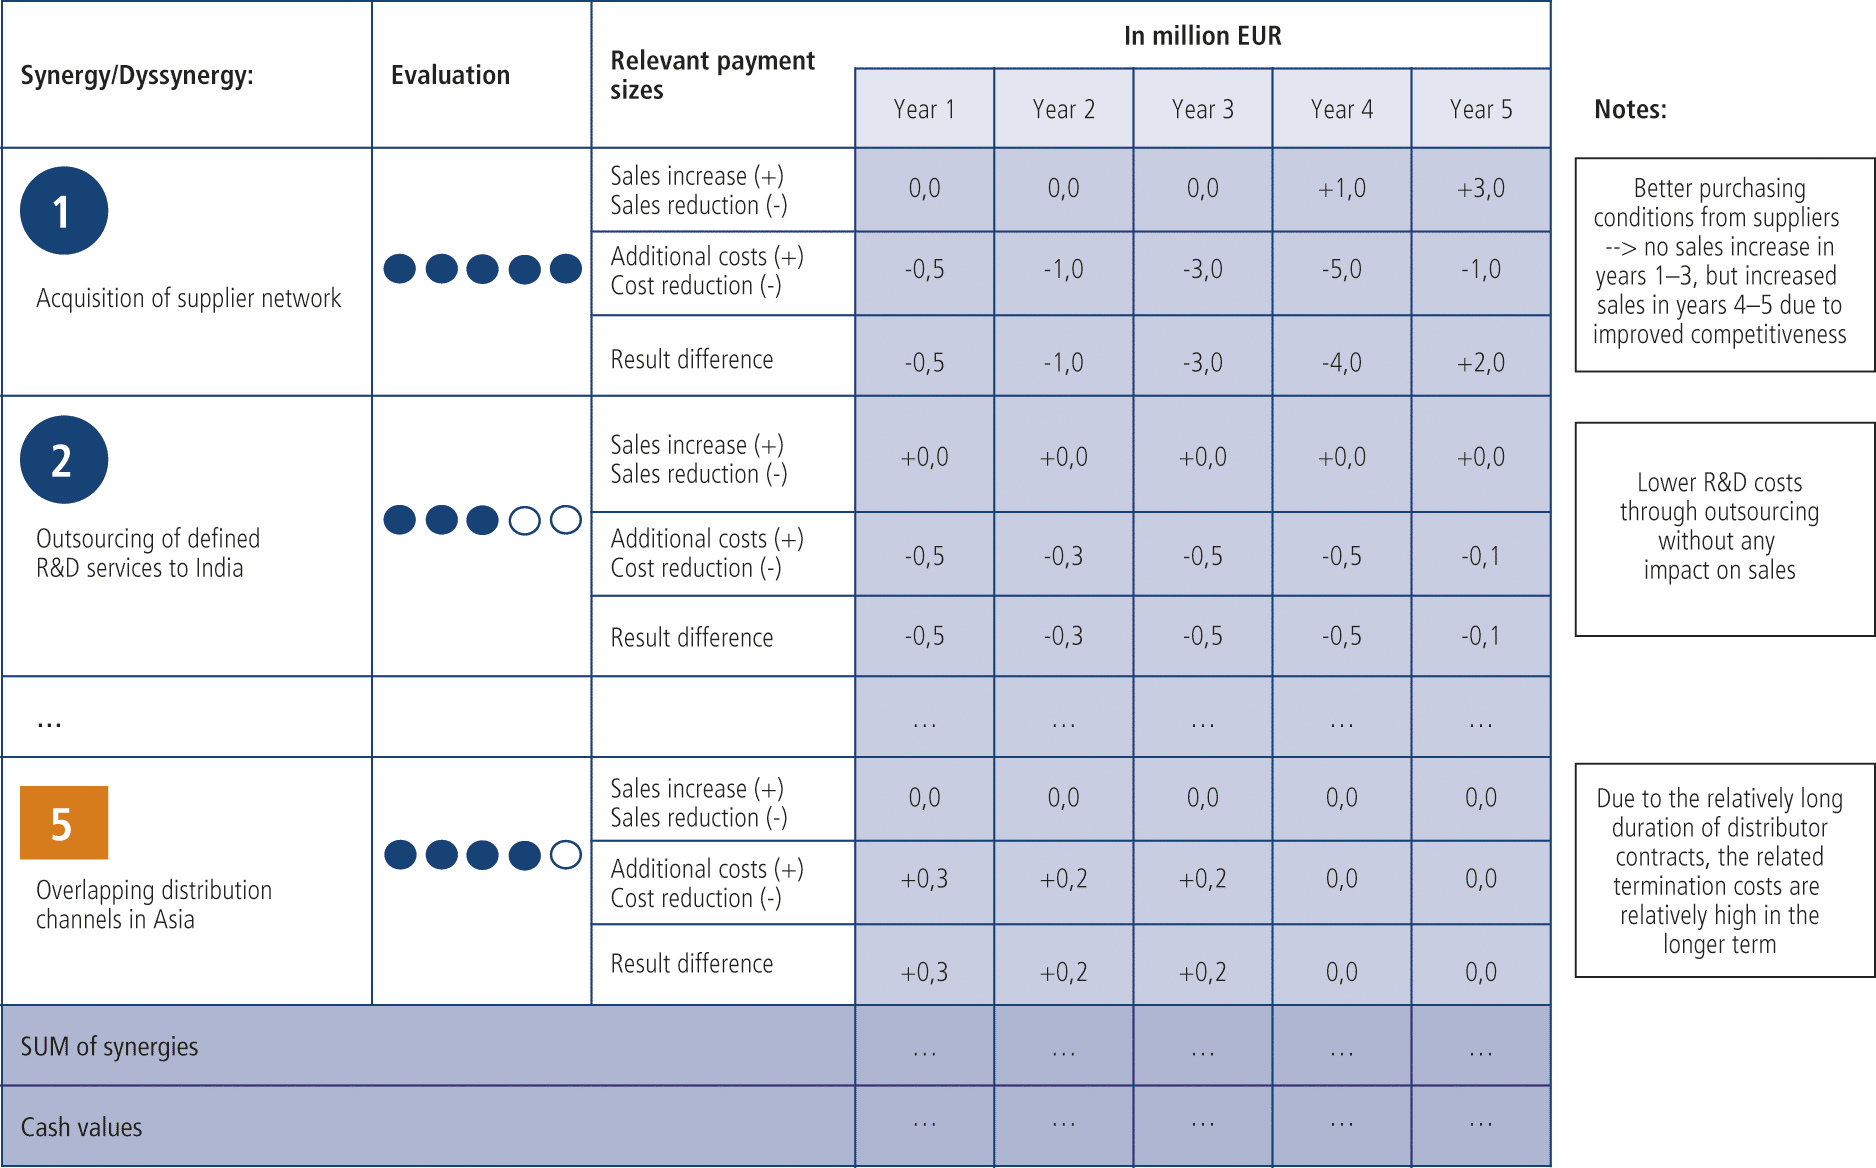
As evaluation period, the next five years may be advisable. It should be strongly emphasized that the data refer to which extra revenue arises by combining both business models. The same applies to the cost side: Which costs are eliminated by combining the two business models? In addition, an assessment must also be made regarding the impact of additional revenues on the cost side. In addition, an assessment of the impact of additional revenues on the cost side is also required. This is the case, for example, in productionoriented industries. Here an extra revenue also attracts higher production and purchase costs, in the form of higher product sales. An exception of this effect shows up for example in the sale of standard software. Here production and purchase costs play a subordinate role. In the end, net margins have to be considered.
The consideration of net margins leads to the ultimate quantification figure for the (dys)synergies which is Net Cash Flow. The advantage of this target figure is that it has a close relation with typical profit ratios of a company. It complies for example with value-based management. Furthermore, the connection to the usually employed company evaluation method “Discounted Cash Flow” guarantees the easy usage of the data and insights gained from the M&A Canvas in latter working packages of the M&A process like detailed evaluation of the target.
After all the relevant (dys)synergies were quantified as part of a five-year planning, subsequently a consideration of probabilities takes place. For this purpose, for each (dys)synergy from the M&A Canvas a probability must be determined and then multiplied by the calculated value in step IV. The concept of triangular distribution is well applicable here,[3. Cf. Albright/Winston/Zappe: Data Analysis and Decision Making, 4th edition, Mason (OH, USA), 2011; Raydugin: Project Risk Management: Essential Methods for Project Teams and Decision Makers, Hoboken (New Jersey), 2013] in which the minimum value, the maximum value and the most likely value are included in the analysis, and from this an expected value can be formed. Note: The user does not have to estimate probability, since it is implicitly determined by the three values.[4. Refer to Gleißner/Leibbrand/Kamaras/Helm/Gerking: Krisenprävention: Stresstests für das Unternehmen? in: Risiko Manager, 2011 (18), pp. 1, 6-15.]
The cash values can be optionally calculated based on the total of the synergies determined and based on the estimated realizability in order to meet the aspect of the expected return level.
The sum of the synergies or the calculated cash values then allow a concrete comparison of different M&A options, in other words they quantitatively answer the question of which combination of business models has the greatest synergy potential.
Step V: Information transfer for financial company evaluation
The resulting quantified synergies might provide valuable input in the further M&A process. At this point, we refer to the corresponding literature, in which different methods of business valuation are presented.[5. Cf. for example Ernst/Schneider/Thielen: Unternehmensbewertungen erstellen und verstehen, München, 2012; Sudarsanam: Creating Value from Mergers and Acquisitions, 2nd edition, Harlow (UK), 2010, pp. 437-447]
2.2 Synergy identification and evaluation within the M&A Canvas – examples
In the following, selected (dys)synergies observed in practice and their effects on turnover and costs will be briefly explained using examples (for the different canvas field also see figure 3).
(1) Canvas field “customer segments”
An often observed synergy pattern is a target’s access to a specific customer segment. This enables the buyer of the company to distribute its own products to the new customer segment that has been opened up with the transaction at low cost. Thus, additional sales can be generated without incurring significant additional costs in sales activities.
As an example of a dyssynergy, the argument of profit in market share may be mentioned, which also is frequently mounted in the strategic fit analysis. Thus, a merger of two suppliers can cause that certain customers look for a new second source of purchase, for reasons of reduction of dependence on suppliers. Another example may be “cannibalization”. The products of the new parent company eat away the turnover of the target with the customers. That may result in lower cash flows if the margins of the new products are lower.
(2) Canvas field: “key resources”
One common synergy in this field is the use of a strong brand name owned either by the target or the buying company. For example, if the buyer brings along a strong brand name, it may also enable the buyer to impose a price premium on the target company’s products while maintaining the same cost position. The acquisition of a brand can, of course, lead to significant dyssynergies in the case of poor brand management following the transaction. Further, frequently attractive key resources can include internal know-how, patents held and available customer information.
(3) Canvas field: “key activities”
A typical example of synergy in this canvas field is a forward or backward integration in the existing industrial value chain. For example, a key supplier might be acquired within the framework of a backward integration in order to be able to better differentiate from competition within the framework of the value offer. On the other hand, such an approach could also result in the acquired supplier suffering a massive loss of business, as the transaction has lost its “neutrality” vis-à-vis other market participants.
(4) Canvas field: “value proposition”
The canvas field of the value proposition often plays a central role in takeover considerations. One example is the acquisition of a company that completes the existing value proposition and thus makes a provider an attractive full-range supplier for customers in the sense of a one-stop shopping opportunity. The new constellation as a whole can generate extra revenue through the thereby achieved additional “shopping convenience”. A dyssynergy within the value proposition, however, may again be the above mentioned cannibalization effects, which can cause a decrease in the consolidated turnover.
(5) Canvas field: “distribution channels”
A synergy in the canvas field of distribution channels might be, for example, the acquisition of a company that has a dense distribution network through which the buyer’s products can be marketed without additional effort. As dyssynergy, however, other distribution channels can cannibalize one another and additional costs can arise as a result of the necessary adjustment.
(6) Canvas field: “key partner”
In the field of “key partner”, the issue of supplier’s access often provides an interesting synergy potential. For example only the acquisition of a company might enable the access to key technology suppliers, which were previously tied exclusively to a customer.
2.3 Example
The following example serves to clarify the steps described in 2.1.
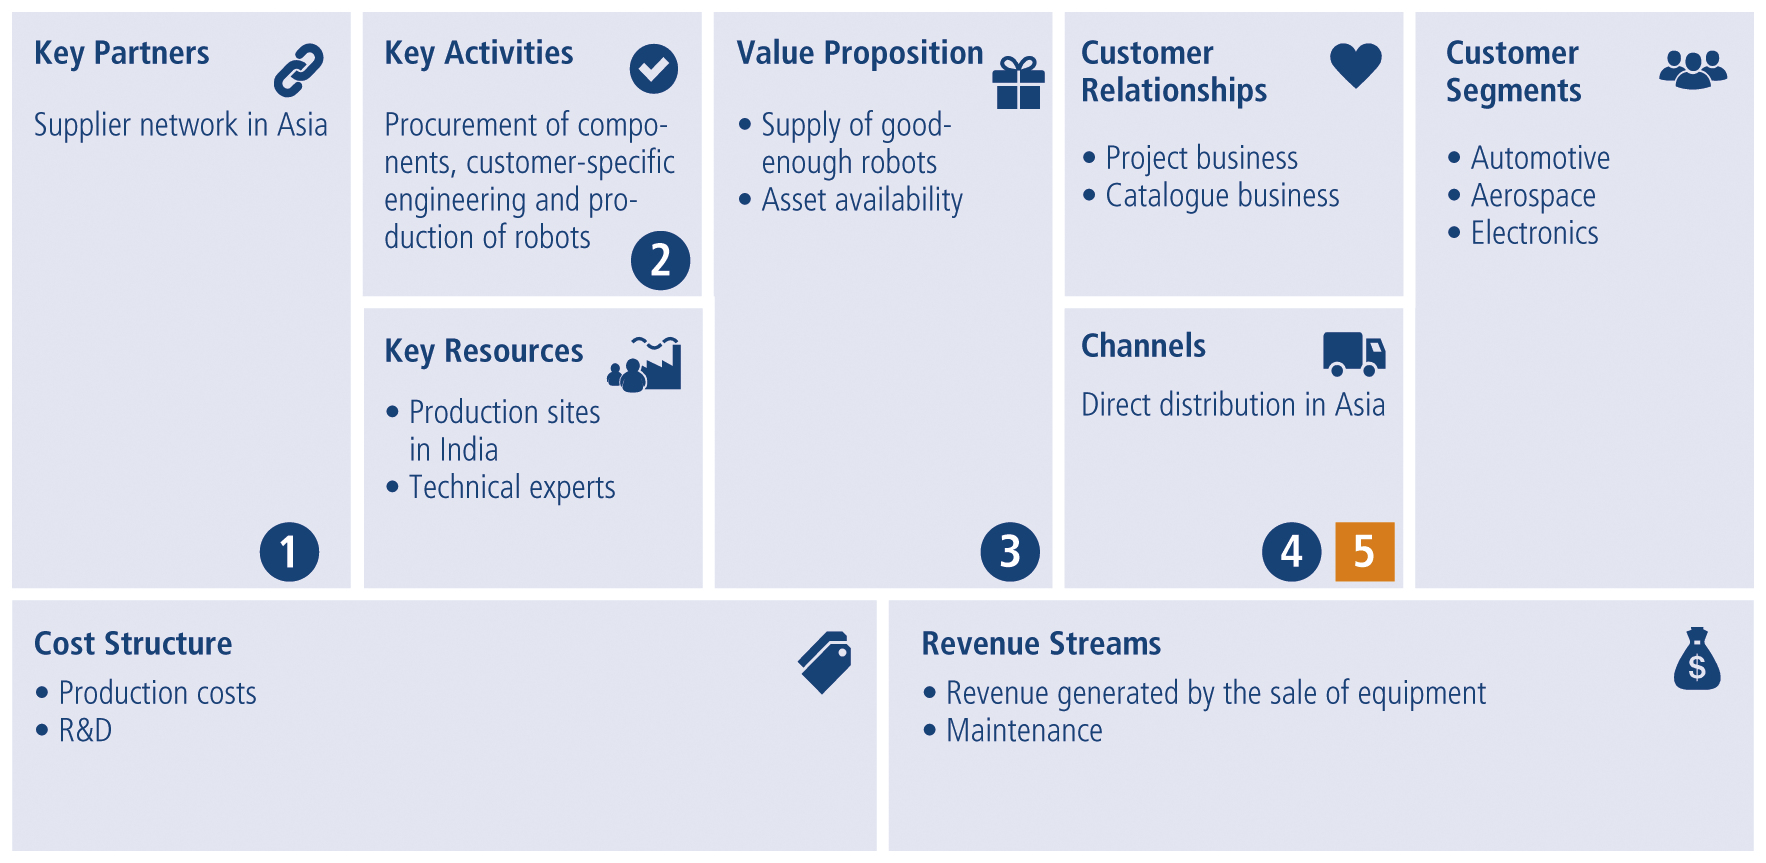
Premium robotics manufacturer A, based in Aachen, Germany, is considering an acquisition of an Indian competitor from the Good Enough segment, i.e. the products and systems of the Indian target are positioned in the lower level of the market. With this acquisition, company A intends to expand its presence in the Indian market and aims to enter the Good Enough market. In a first step, A identifies the respective two canvas business models (see Fig. 4 and 5).
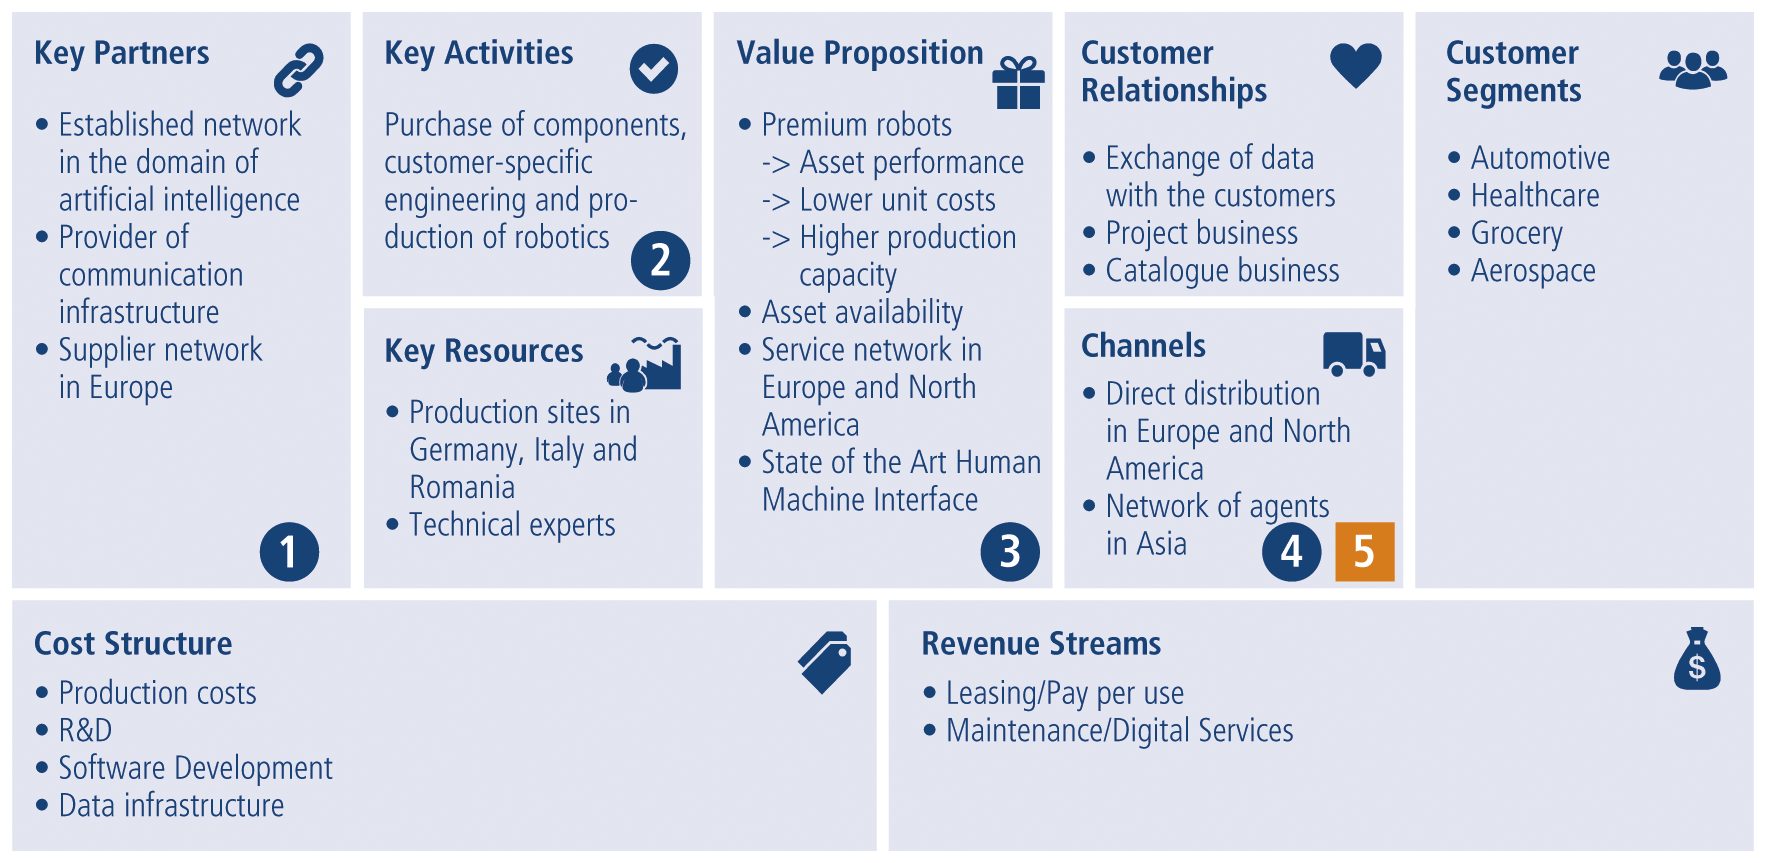
In a second step, the (dys)synergies are derived from the identified canvas fields (see numbered circles in Fig. 4 and 5 above and in Figure 6 below).
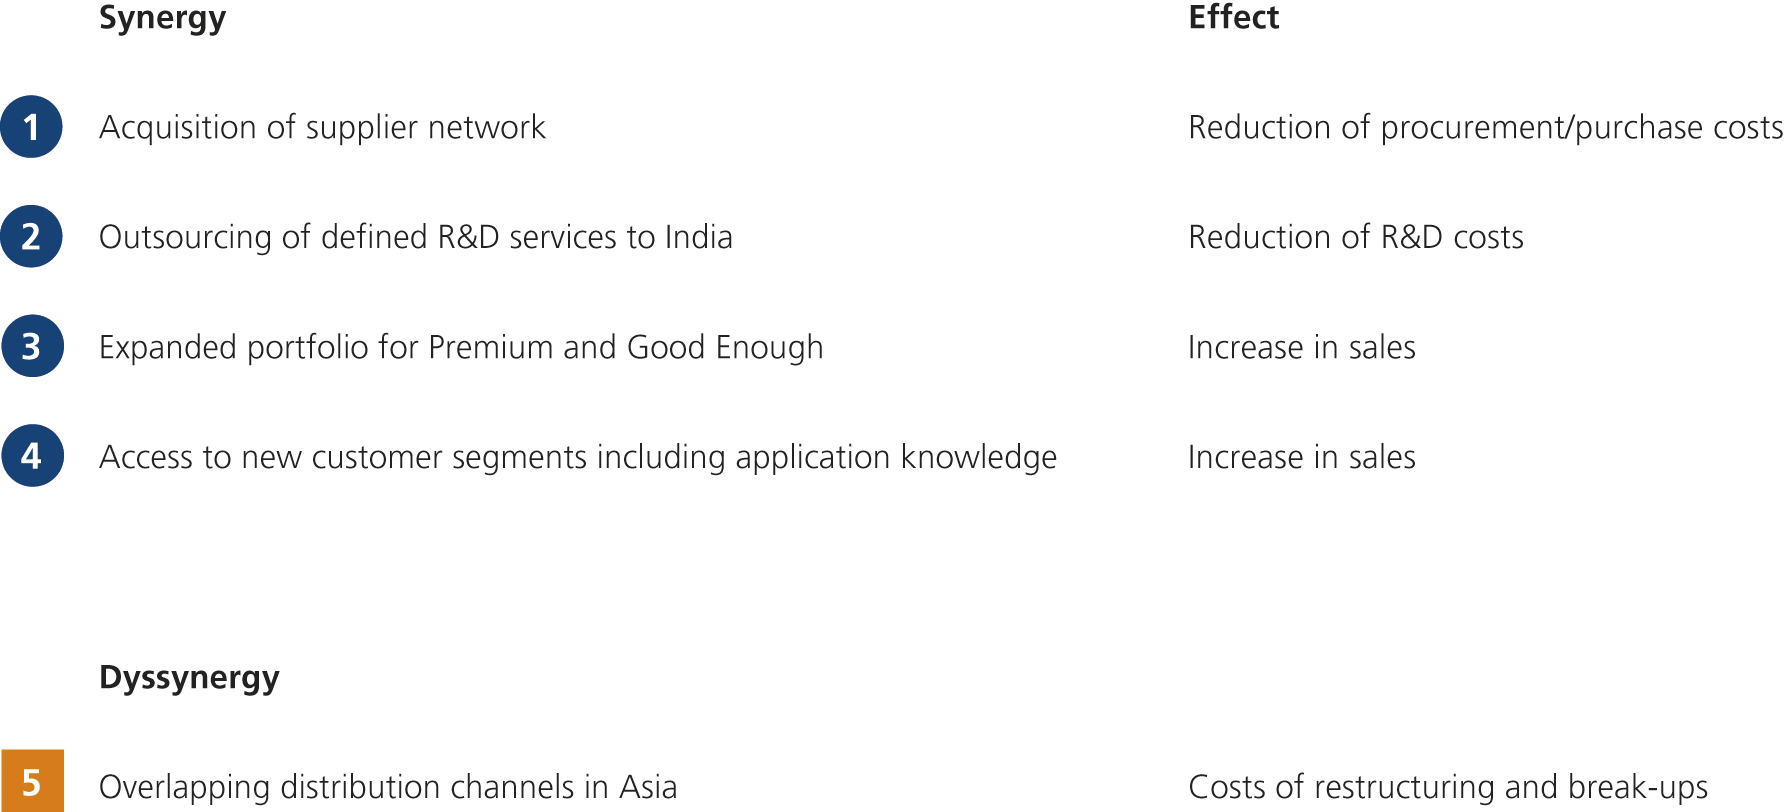
Figure 7 shows steps 3 and 4 (more precisely, the qualification and quantification of the synergies). The transfer of information (Step 5, as described in 2.1) will not be described in more detail for this case.
2.4 The advantages and disadvantages of the presented method
In the following, the advantages and disadvantages of the presented method of the M&A Canvas are briefly explained.
A major advantage of using the M&A Canvas method is to enable a highly targeted discussion and evaluation of potential M&A candidates, because all in the process elaborated aspects can be displayed in very compressed form. Emotional aspects of decision-makers can be substantially reduced due to the highly structured process. The clear focus on the identification and evaluation of synergy potentials prohibits a common and barely helpful evaluation of the strengths and weaknesses of the target.
Furthermore, the M&A Canvas enables a holistic view of potential M&A candidates. In particular, the portfolio analyses often used for strategic fit evaluations are limited to only a few aspects or perspectives. The M&A Canvas method also systematically takes up the identification and in particular the quantification of dyssynergies.
Another advantage is the result format’s clarity that is essentially achieved by the M&A Canvas that is displayable on one side and through the synergy quantification. Since the review aspects of the canvas elements always remain the same, but the synergy expression is not subject to methodical order compulsion, the method of M&A Canvas allows a comparison of greatly pronounced M&A projects.
In conclusion, it should be mentioned from the holistic M&A process view that the M&A Canvas offers a very good basis for further assessment of M&A projects, as it brings quantified knowledge and these can then be incorporated into the corresponding financial mathematical valuation models. Generally, the M&A Canvas lays a solid data base for the further processing of the M&A process.
A major disadvantage of the developed M&A Canvas method is, that for the targeted preparation of both one’s own and the target business model a certain degree of exercise is required. This concerns in particular the issue, which aspects should be added to the canvas documentation. Unexperienced users tend to fill out the canvas as completely as possible. They often lose sight of the really essential points.
Another issue is the sole focus on synergies as the determining factor for the strategic fit. There is a danger that transactions which are executed for reasons of strategic diversification may be underestimated in their potential. This risk may be countered by employing a broad understanding of synergies and thus including also positive/negative effects of expanding one’s business to different markets.
Another disadvantage or rather requirement is, that for the application of the M&A Canvas one has to understand the own business model and in addition to that the business model of the target. Nevertheless, apart from all canvas considerations, the understanding of the important components of the business of the target is a pre-condition for a successful M&A, let alone the deep knowledge of one’s own business activities.
3. An extension of the M&A Canvas
The above presented method of the assessment of acquisition targets as part of the pre-acquisition phase is focusing on the perspective of the strategic fit (see also chapter 2). Thereby, the aspects of culture-fit, the organizational and financial fits were not considered. As mentioned above, the analysis of all four aspects represents an essential basis for decisions for selecting appropriate acquisition candidates.[6. Cf. exemplary Coenenberg/Schultze, 2011, pp. 357–360; Helm/Strohmayer: Bewertung von Kooperationspartnern für Category Management und Efficient Consumer Response, in: M & M, 41 (6), 1997, pp. 241–244; Jansen, 2008, pp. 216–217; Lucks/Meckl, 2015, pp. 121–129.] Thereby, the resulting need for expansion of M&A Canvas is shown in figure 8 above. Besides the well-known M&A Canvas fields, the missing criteria will be included in this very holistic assessment. The company will be rated from the “stand alone” perspective, as well as the fundamental organizational and cultural fit of the target will be considered.
The amendments are done on a qualitative basis and on a high level of aggregation. They are the result of deeper cultural, organizational and financial fit analyses which may be executed by using adequate instruments. [7. See for example Clarke: Acquisitions-techniques for measuring strategic fit, in: Long Range Planning, 20 (3), 1987, pp. 12–18; Coenenberg/Schultze, 2011, pp. 357–378; Lucks/Meckl, 2015, pp. 122–128| The proposed procedure in figure 8 mainly serves for completing the screening in one, well presentable display for further discussions for every relevant target.
4. Conclusion
M&A activities, depending on the relative magnitude of the transaction compared to the size of the company of the buyer, often constitute dramatic moments in the company’s history.
In many cases, thus, they have a huge effect on the future success of the company or even on the question of the viability of the company. Nevertheless, it should be noted that there still does not exist a widely accepted and practical used method of strategic fit assessment of M&A candidates. The M&A Canvas as a combination of existing methods and the business model logic of Osterwalder/Pigneur has the potential to fill this gap. The widespread use of the canvas in strategic planning allows for a well-connected extension of this instrument to the task of selecting and evaluating acquisition candidates in a comprehensive assessment.